Ranking the most viewed people on Wikipedia in 2020 (so far)
In the previous posts, we looked at loading all of the 1.2 TB of page views data from Wikipedia, and ranking the most popular people by day. The final step involves bringing all the data together into a visualisation.
Top 20 pages (people) by view count: 1 January - 30 June 2020
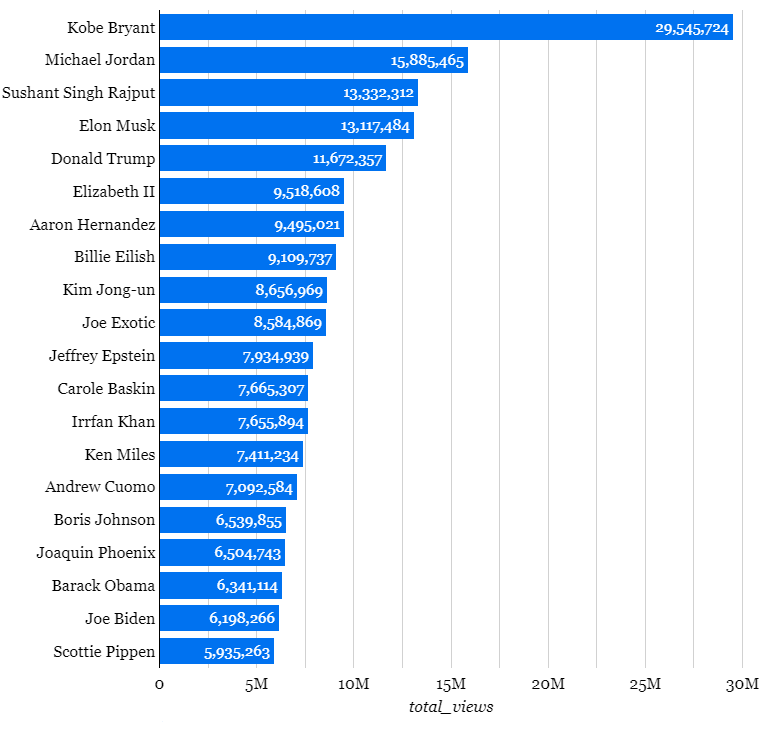
In a year that has been dominated by news about COVID-19, it’s interesting to see which people have had the most views on Wikipedia.
Kobe Bryant’s tragic death in January caused a huge spike in searches for the basketball player. His page received well over 8 million views on January 26.
Michael Jordan had a significant boost in views following the release of the Netflix documentary The Last Dance. He regularly made the top 5 most viewed per day throughout April and May.
Elon Musk often featured in the most viewed pages each day, contributing to his spot in the top 5. Interest in his page increased immediately after the birth of his child, named X Æ A-12.
The meteoric rise in popularity of Joe Exotic and Carole Baskin came after the release of Netflix’s Tiger King: Murder, Mayhem and Madness. In terms of daily views, Joe Exotic often beat prominent political figures, including Donald Trump and Queen Elizabeth II.
Visualising the data over time
There are many more people that caught the fascination of Wikipedia’s readers in the first half of 2020. Looking at the top 20 fails to capture the detail over the time period. A line chart would show interest over time, but it would likely look cluttered with more than five people. Lines are also difficult to associate with an individual person.
A relatively new data visualisation that has gained significant popularity online is the ‘racing bar chart’. Racing bar charts animate the results for each time interval. In our case, we’re looking at the views on each person’s page by day. There are a number of advantages and disadvantages to displaying the data with a racing bar chart:
Advantages
It is easy to distinguish who are the most viewed people on a given day;
A bar chart shows the magnitude of difference in views clearly;
We can show the data for hundreds of pages, without the chart becoming overly cluttered;
The animation draws the viewer in, and invites them to engage with the data.
Disadvantages
To see all of the information in the chart, the viewer has to watch the animation to the end.
Because of the way the animation interpolates the data, it looks like views go down in a day. Daily views are a static figure when aggregated.
We are limited to showing the top n pages view counts, losing some information about the lesser viewed pages.
Often, no one visualisation is perfect for showing all of the data in the clearest way possible. We will build a racing bar chart and judge its effectiveness.
The first step is to extract the data from Google BigQuery through the Python API:
We then update the formatting of the columns to load into the Observable notebook:
The CSV is then loaded into an Observable notebook, based on the Bar Chart Race, Explained notebook by Mike Bostock. Mike does an excellent job of explaining how the visualisation works on his Observable platform. The bar chart race above is adapted from his work, with a few formatting updates.
Final thoughts
The racing bar chart can be effective at engaging viewers. It certainly has its limitations, as outlined above, but gives us another tool for presenting data in an engaging way. “Visualisation for visualisation’s sake” is generally one to avoid, but in this case a racing bar chart can be a good way to lead into more detailed views of the data. Keeping the bars static, and allowing the user to filter over a date range would convey the information more clearly. However, it would require that the user directly interacts with the data, which can be unintuitive for some people.