A song of nodes and edges – Network analysis in Game of Thrones

Source of character images: HBO
To demonstrate the concept of network analysis, I built an interactive, force-directed graph of character relationships for each of George R.R Martin's Game of Thrones novels using D3.js and Tableau. The Network of Thrones article by Andrew Beveridge and Jie Shan inspired the work. The source data gathered from the novels can be found on Andrew Beveridge's GitHub.
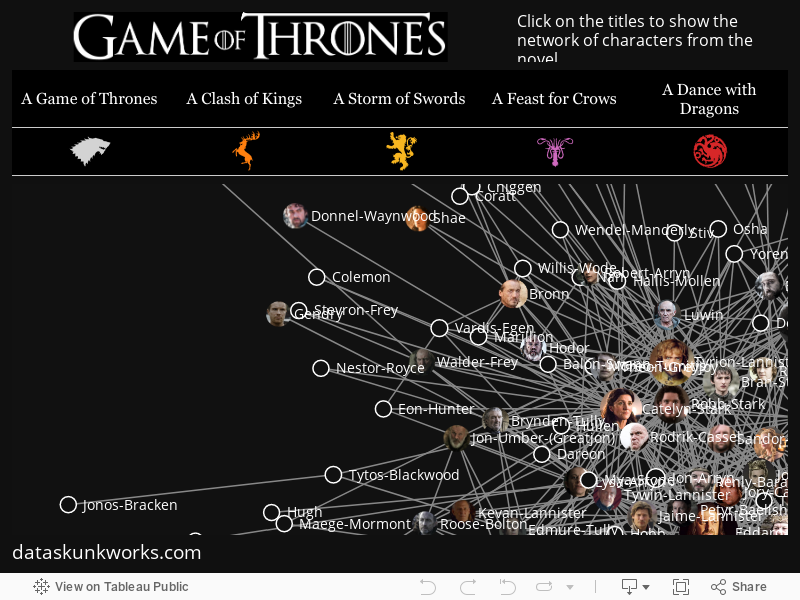
The characters that feature in the novel are listed as the 'nodes' in the network. A connection or 'edge' is counted when two character’s names appear within 15 words of each other.
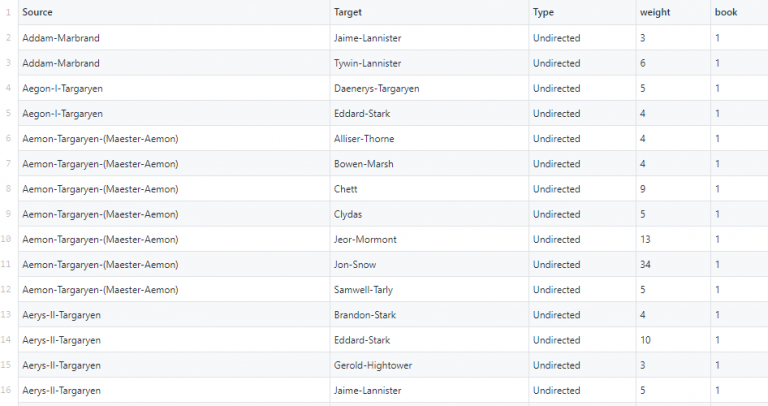
An example of the 'edge' data from Book 1
The source data doesn't tell us much about the importance of particular characters, or whether they're in a community. Visualising the data shows these features of the social network. Interestingly, clustered networks appear to align closely with the geographic locations of the characters.
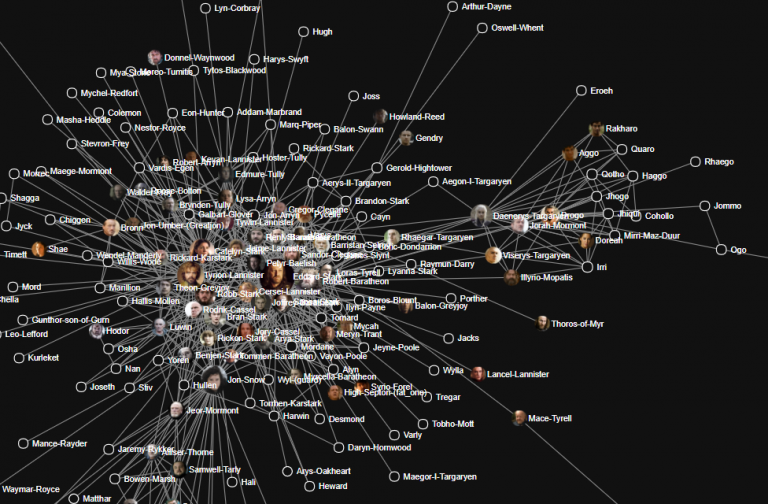
On the right side of the network for Book 1, we can see the cluster of Daenerys and her Dothraki.
Simply by looking at the connections between all of the characters, the separated geography of Westeros and Essos is revealed.

Links between characters in the network can tell us who the most important characters are. The Google PageRank algorithm was originally designed to measure the importance of website pages, in order to provide the ‘most important’ and most relevant search results to Google search users. According to Google:
PageRank works by counting the number and quality of links to a page to determine a rough estimate of how important the website is. The underlying assumption is that more important websites are likely to receive more links from other websites.
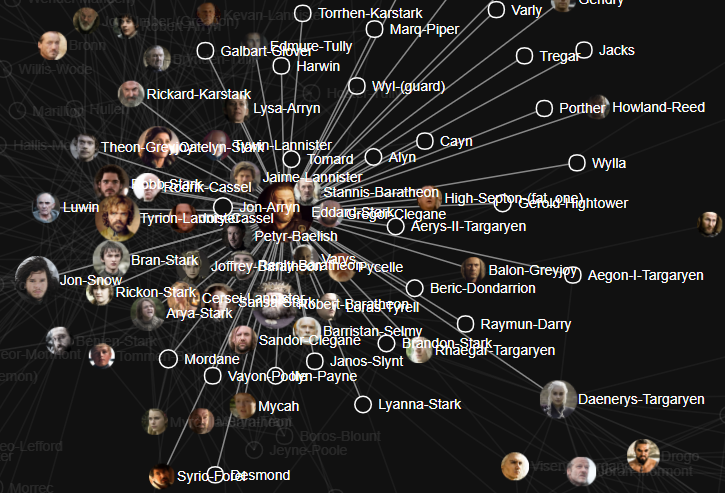
Characters and their relationships are essentially the same as web pages and the hyperlinks that link them together. The Gephi package was used to run the PageRank algorithm over the data and assign a weighting to each character. The weighting has been visualised by resizing each node. In the first novel, Ned Stark features heavily in the narrative, as he features in multiple plot lines.
Network analysis can be an extremely useful tool for organisations hoping to better understand how information flows through certain people. Diesner, Frantz and Carley explored the open source Enron email data in their paper Communication Networks from the Enron Email Corpus: "It's Always About the People. Enron is no Different." The authors explored the dynamics and structure of the organisational network, as well as the characteristics and patterns of communicative behaviour of the employees from different organisational levels. The Enron email corpus provided a rich, real world record of communication in a company facing major turmoil. From the paper:
We found that during the crisis period, communication among employees became more diverse with respect to established contacts and formal roles. Also during the crisis period, previously disconnected employees began to engage in mutual communication, so that interpersonal communication was intensified and spread through the network, bypassing formal chains of communication.
Australian metadata retention laws came into effect in April 2017. When first introducing the legislation, Tony Abbot used the metaphor that "metadata is the material on the front of the envelope, and the contents of the letter will remain private". To the layperson, this description of metadata sounds relatively innocuous. While individual points of metadata may not be revealing, the aggregation and use of sophisticated clustering algorithms can expose critical insights into flows of information and key actors in a network. Organisations can use the data that they own to answer questions such as:
Who are our ‘key players’ and ‘information gatekeepers’ in each department?
Which departments are not communicating well with each other?
Which networks would suffer the most if a particular ‘key employee’ were to resign? Similarly, which would experience little impact if an extraneous employee was made redundant?
All of the questions above can be explored without reading the content of a single email. Communication metadata between employees can be aggregated to give insight into both the individuals in the network and the network as a whole.
The force-directed graph of character relationships was generated using Mike Bostock's open source D3.js JavaScript library. The code for the networks and the facial recognition script used to create the character portraits can be found on my GitHub.